Beta Control Charts
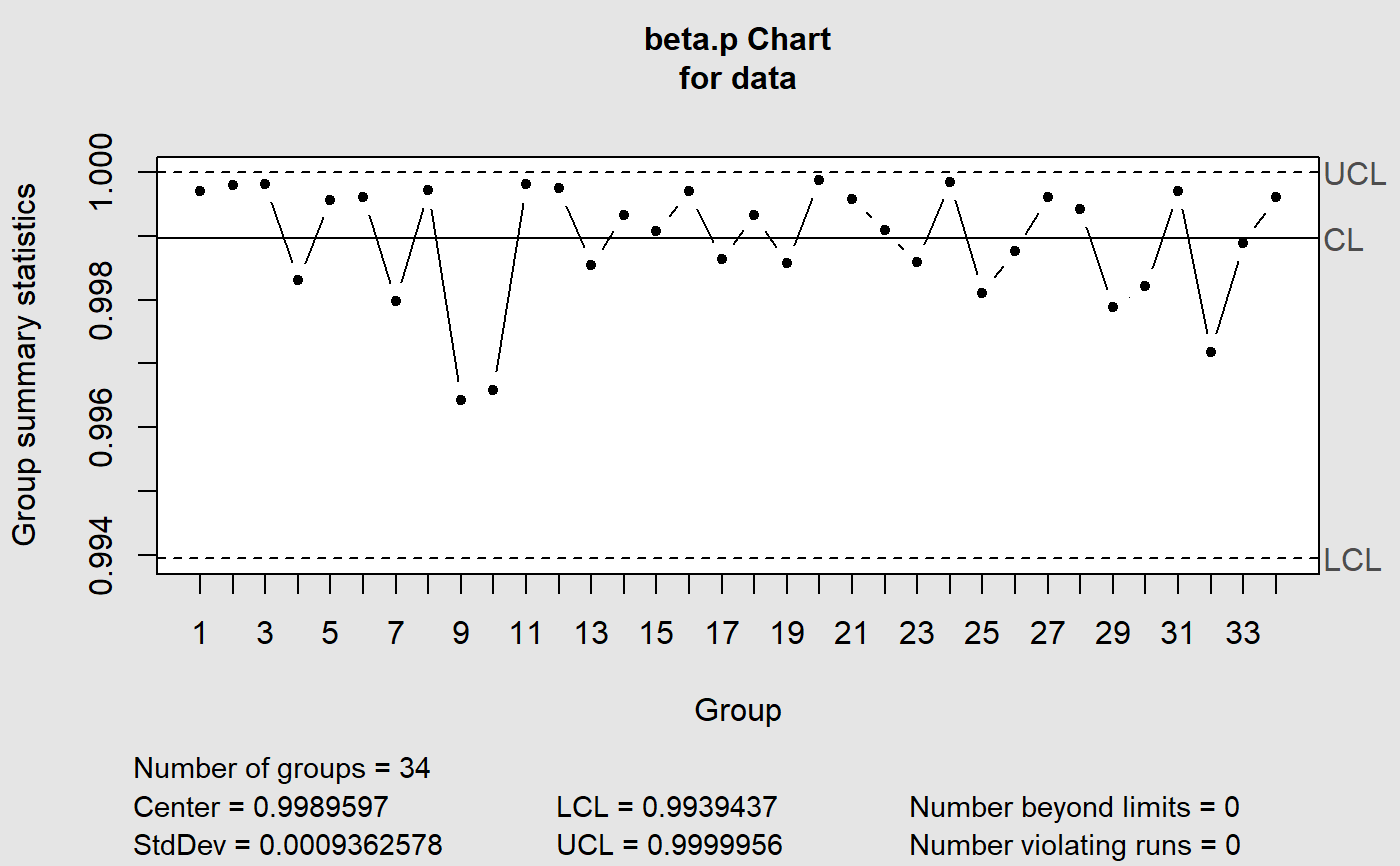
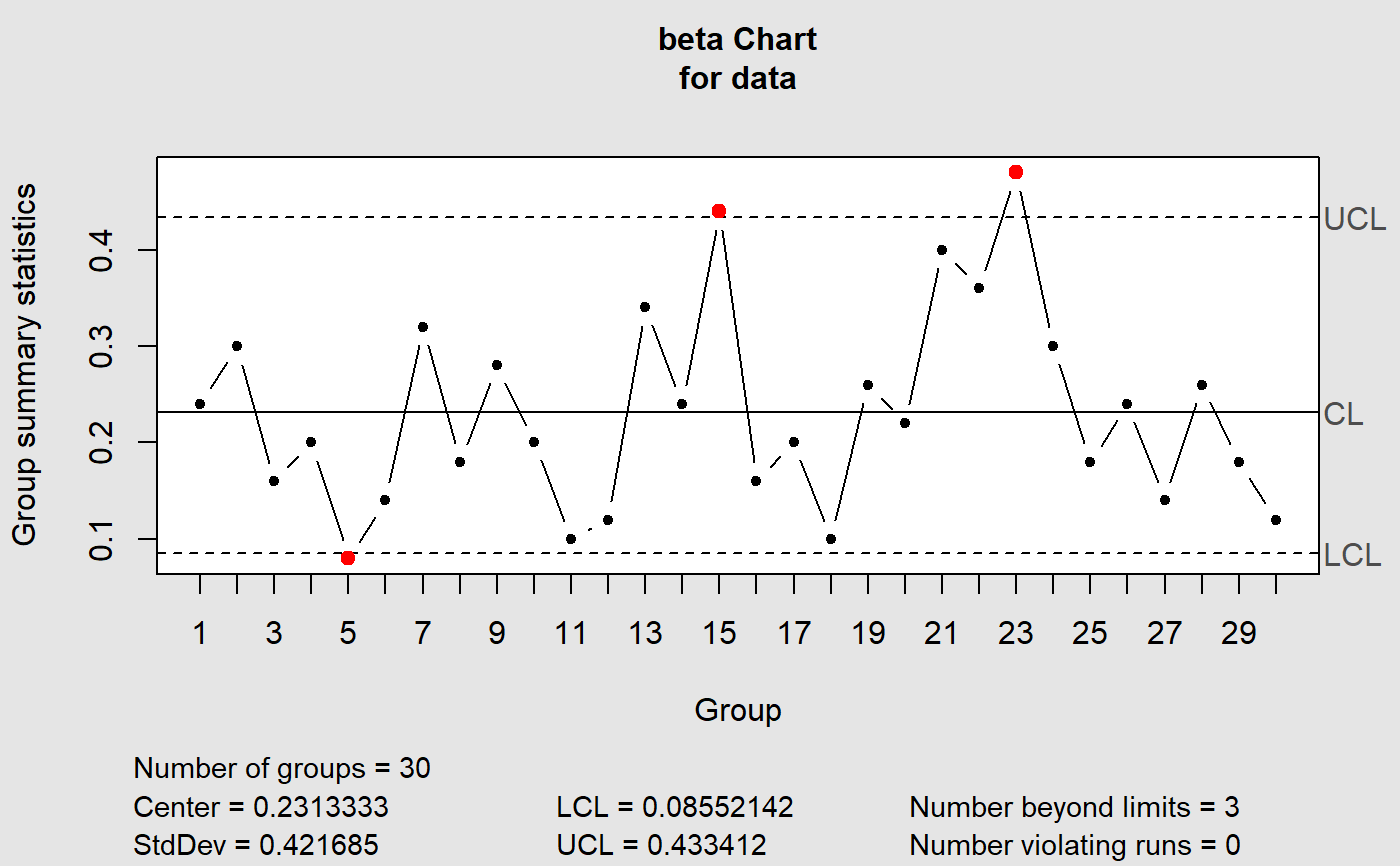
bcc.RdCreate an object of class 'qcc' to perform statistical quality control. This object may then be used to plot Beta Control Charts.
bcc(data, type = c("1", "2"), sizes, center, std.dev, limits, data.name,
  labels, newdata, newsizes, newdata.name, newlabels, nsigmas = 3,
  confidence.level = 0.9, rules = shewhart.rules, plot = TRUE, ...)
Arguments
| data | a data frame, a matrix or a vector containing observed data for the variable to chart. Each row of a data frame or a matrix, and each value of a vector, refers to a sample or ''rationale group''. |
|---|---|
| type | a character string specifying the group statistics to compute. There are two possible types: |
| sizes | a value or a vector of values specifying the sample sizes associated with each group. If data is continuous this parameter should be ignored |
| center | a value specifying the center of group statistics or the ''target'' value of the process. |
| std.dev | a value or an available method specifying the within-group standard deviation(s) of the process. |
| limits | a two-values vector specifying control limits. |
| data.name | a string specifying the name of the variable which appears on the plots. If not provided is taken from the object given as data. |
| labels | a character vector of labels for each group. |
| newdata | a data frame, matrix or vector, as for the |
| newsizes | a vector as for the |
| newdata.name | a string specifying the name of the variable which appears on the plots. If not provided is taken from the object given as newdata. |
| newlabels | a character vector of labels for each new group defined in the argument |
| nsigmas | a numeric value specifying the number of sigmas to use for computing control limits. It is ignored when the |
| confidence.level | a numeric value between 0 and 1 specifying the confidence level of the computed probability limits. |
| rules | a value or a vector of values specifying the rules to apply to the chart. See shewhart.rules for possible values and their meaning. |
| plot | logical. If |
| ... | further arguments are ignored. |
Value
Returns an object of class 'qcc'.
Details
The Beta Chart presents the control limits based on the Beta probability distribution. It was can be used for monitoring fraction data from Binomial distribution as replacement of the p-Charts. The Beta Chart was applied for monitoring the variables in three real studies, and it was compared to the control limits with three schemes. The comparative analysis showed that: (i) Beta approximation to the Binomial distribution was more appropriate with values confined in the [0, 1]- interval; and (ii) the charts proposed were more sensitive to the average run length (ARL), in both in-control and out-of-control processes monitoring. The Beta Charts outperform the Shewhart control charts analyzed for monitoring fraction data.This package was made based on the qcc package. See qcc.
References
SANT'ANNA, Ângelo M. O; CATEN, Carla Schwengber ten. Beta control charts forsave monitoring fraction data. Expert Systems With Applications, p. 10236-10243. 1 set. 2012.
Scrucca, L. (2004). qcc: an R package for quality control charting and statistical process control. R News 4/1, 11-17.
Examples
#> List of 11 #> $ call : language qcc(data = data, type = "beta.p", center = center, std.dev = std.dev, limits = limits, data.name = data.name| __truncated__ ... #> $ type : chr "beta.p" #> $ data.name : chr "data" #> $ data : num [1:34, 1] 1 1 1 0.998 1 ... #> ..- attr(*, "dimnames")=List of 2 #> $ statistics : Named num [1:34] 1 1 1 0.998 1 ... #> ..- attr(*, "names")= chr [1:34] "1" "2" "3" "4" ... #> $ sizes : int [1:34] 1 1 1 1 1 1 1 1 1 1 ... #> $ center : num 0.999 #> $ std.dev : num 0.000936 #> $ confidence.level: num 0.9 #> $ limits : num [1, 1:2] 0.994 1 #> ..- attr(*, "dimnames")=List of 2 #> $ violations :List of 2 #> - attr(*, "class")= chr "qcc"

