Short guide to bcc features
Daniel Lucas Cerqueira
Vignette.Rmdlibrary(bcc)Introduction
qcc is a package for statistical process control and control charts built based on the qcc package, with new functions allowing the use of beta control charts.
This package allows the user to:
- build beta control charts
As the package uses the qcc package as the basis for building the graphics, all qcc functions and utilities also work on bcc. For more informations please consider visiting https://luca-scr.github.io/qcc/.
Application
You can use bcc in two basic ways:
discrete data representing the sample size using
type = 1;continuous data without sample size with values in the range between [0.1] using
type = 2; you can make a ratio between the data to be analyzed for example.
Beta Charts
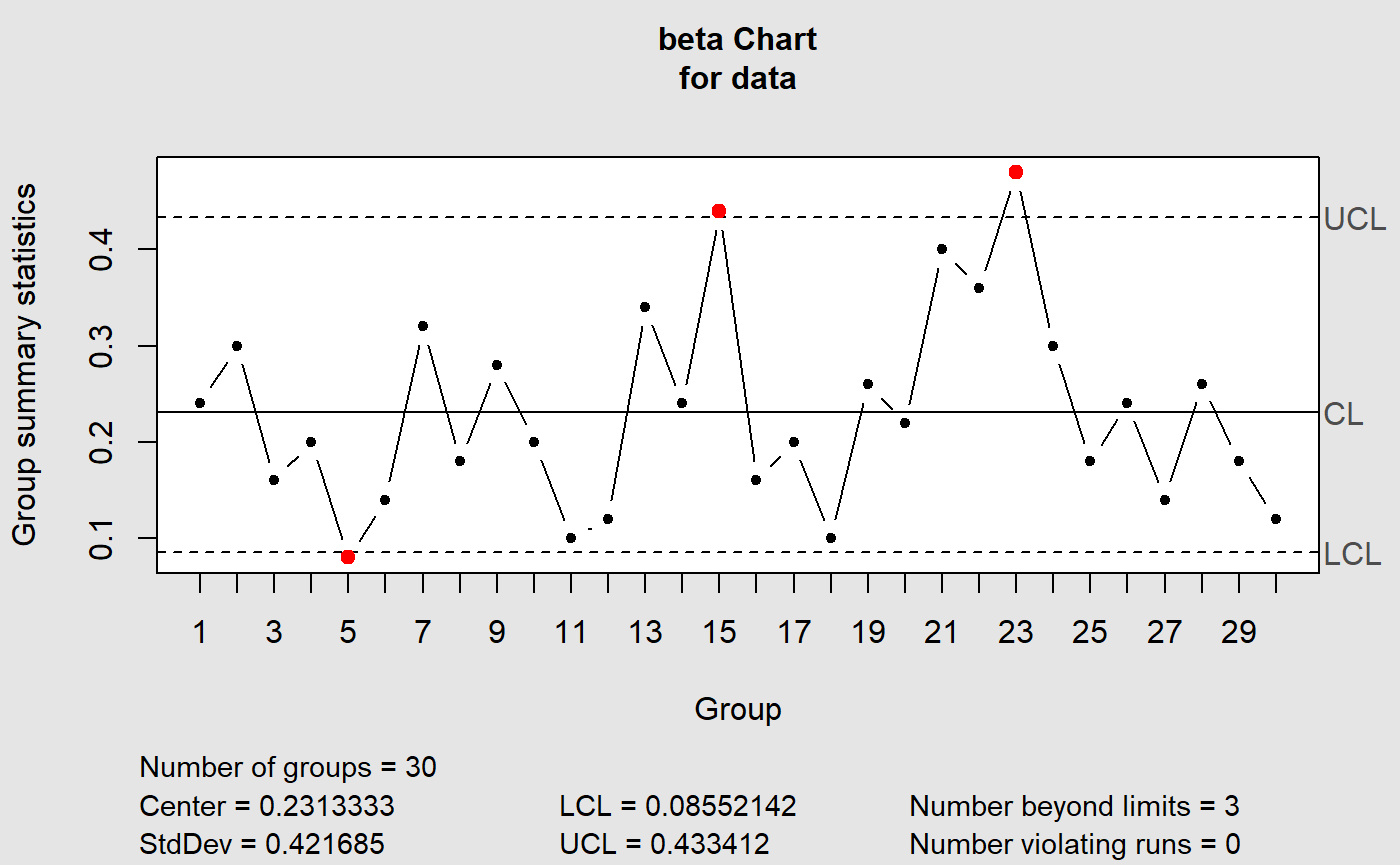
Beta chart for continuos data
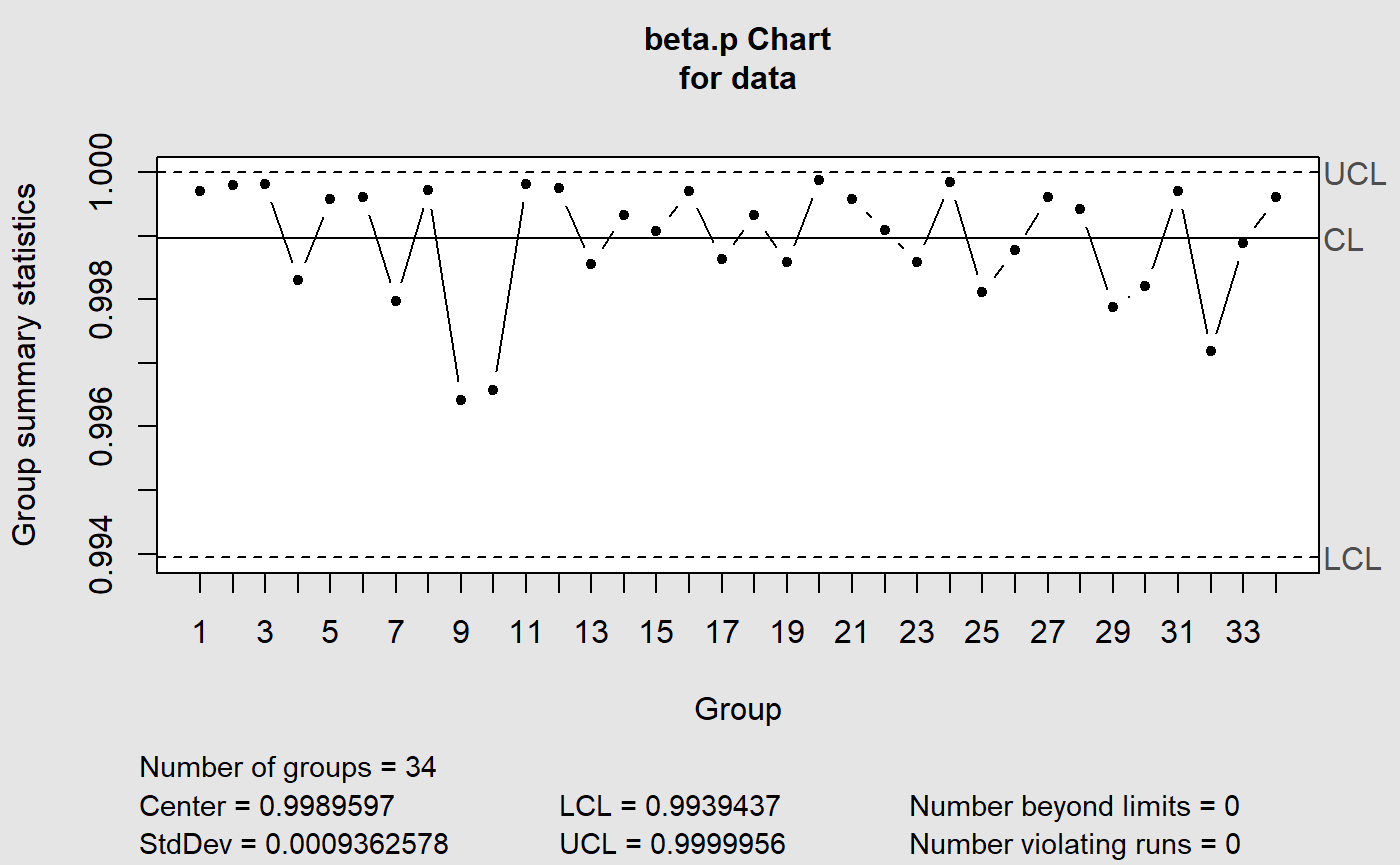
#> List of 11
#>  $ call            : language qcc(data = data, type = "beta.p", center = center, std.dev = std.dev,      limits = limits, data.name = data.name| __truncated__ ...
#>  $ type            : chr "beta.p"
#>  $ data.name       : chr "data"
#>  $ data            : num [1:34, 1] 1 1 1 0.998 1 ...
#>   ..- attr(*, "dimnames")=List of 2
#>  $ statistics      : Named num [1:34] 1 1 1 0.998 1 ...
#>   ..- attr(*, "names")= chr [1:34] "1" "2" "3" "4" ...
#>  $ sizes           : int [1:34] 1 1 1 1 1 1 1 1 1 1 ...
#>  $ center          : num 0.999
#>  $ std.dev         : num 0.000936
#>  $ confidence.level: num 0.9
#>  $ limits          : num [1, 1:2] 0.994 1
#>   ..- attr(*, "dimnames")=List of 2
#>  $ violations      :List of 2
#>  - attr(*, "class")= chr "qcc"
References
Montgomery, D.C. (2009) Introduction to Statistical Quality Control, 6th ed. New York: John Wiley & Sons.
Scrucca, L. (2004) qcc: an R package for quality control charting and statistical process control. R News 4/1, 11-17.
SANT’ANNA, Ângelo M. O; CATEN, Carla Schwengber ten. Beta control charts forsave monitoring fraction data. Expert Systems With Applications, p. 10236-10243. 1 set. 2012.